Global warming has a threatening effect on the future of our planet. Therefore, it is important to reduce greenhouse gas emissions in the industrial sector. Consequently, the sustainability of the electricity and heat supply of the industrial sector is increasingly vital together with the expansion of renewable energy.
The article uses a hypothetical case study of a starch factory to explain that renewable energy can be an optimal solution for the industrial sector. The research examines the supply solutions of wind, solar and biogas plants and is also looking at the integration of battery and hydrogen storage systems.
The project shows promising results which indicate solutions to achieve net-zero carbon dioxide emissions.
Assumptions
The case study is based on a factory in Mecklenburg-Western Pomerania which produces starch and proteins from regionally grown potatoes and peas. It is presumed that the electrical energy consumption is approximately 140 GWh per year. Electricity and heat consumption should mainly be covered by renewable energy. Due to the complexity, thermal consumption is not considered in this case study. Instead, a wind farm (“WF”) and a solar farm (“SF”) with a capacity of approx. 40 MW each as well as a biogas plant with an electrical capacity of approximately 1 MW is used as renewable energy producers.
For the wind energy supply, a close existing WF was selected, and its yield increased to the desired capacity. The SF was simulated using PVsyst (1) and the results were added and used for the case study. The yield and the used substrates for the biogas plant were determined based on example plants.
Wind farm
The WF in Mecklenburg-Western Pomerania is in wind zone two. The four wind turbines from Vestas type V126-3.45 MW have a total rated power of 13.8 MW and have been in operation since 2018. Therefore, sufficient operating data is available for the calculation.
The WF needs to consist of seven turbines of 6 MW to adequately supply wind energy to the starch factory. In the study, the yield data (including the feed-in management measures), the technical availability, the general plant parameters (such as hub height, rotor diameter, power curve), and the long-term correlation of the wind speed are considered for the scaling of the WF. The adapted WF installed with 42 MW would generate a yield of approximately 160 GWh per year.
Solar farm
The solar energy supply near the factory has monocrystalline modules with an efficiency of about 19 % and a total capacity of 40 MW. It is expected that the SF will generate an average of 38 GWh of electricity per year.
Biogas plant
The use of biogas plants is reasonable for this study as the waste products of the factory, e.g. the potato pulp, could be used as substrate. Due to the heat utilisation obligation (2) imposed by law of the EEG 2012, at least 60 % of the heat generated from the biogas plant should be used directly. However, 20-40 % are already consumed by the biogas plant itself for heating the fermenter.
Due to the ongoing production of electrical and thermal energy, the biogas plant is used to cover the base load of the factory in yield profile of renewable energy sources. With an annual utilisation rate or capacity factor of 68 % derived from the full-load hours, the net electrical production is approximately 6 GWh per year or 686 kW per hour.
Load and yield profile
For this case study, the load profile is constantly assumed, meaning that the factory consumption is the same and equally distributed daily. Therefore, seasonal influences such as lighting, heating etc. are not considered.
The factory has a daily electricity demand of approximately 384 MWh and is distributed from 6 am – 9 pm when the factory runs at full load. During the night between 1-3 am the consumption is the lowest at approximately 6 % of the daily demand. In the interim, the factory runs at about 82 % of its full load. Between the phases, the electricity demand is adjusted accordingly.
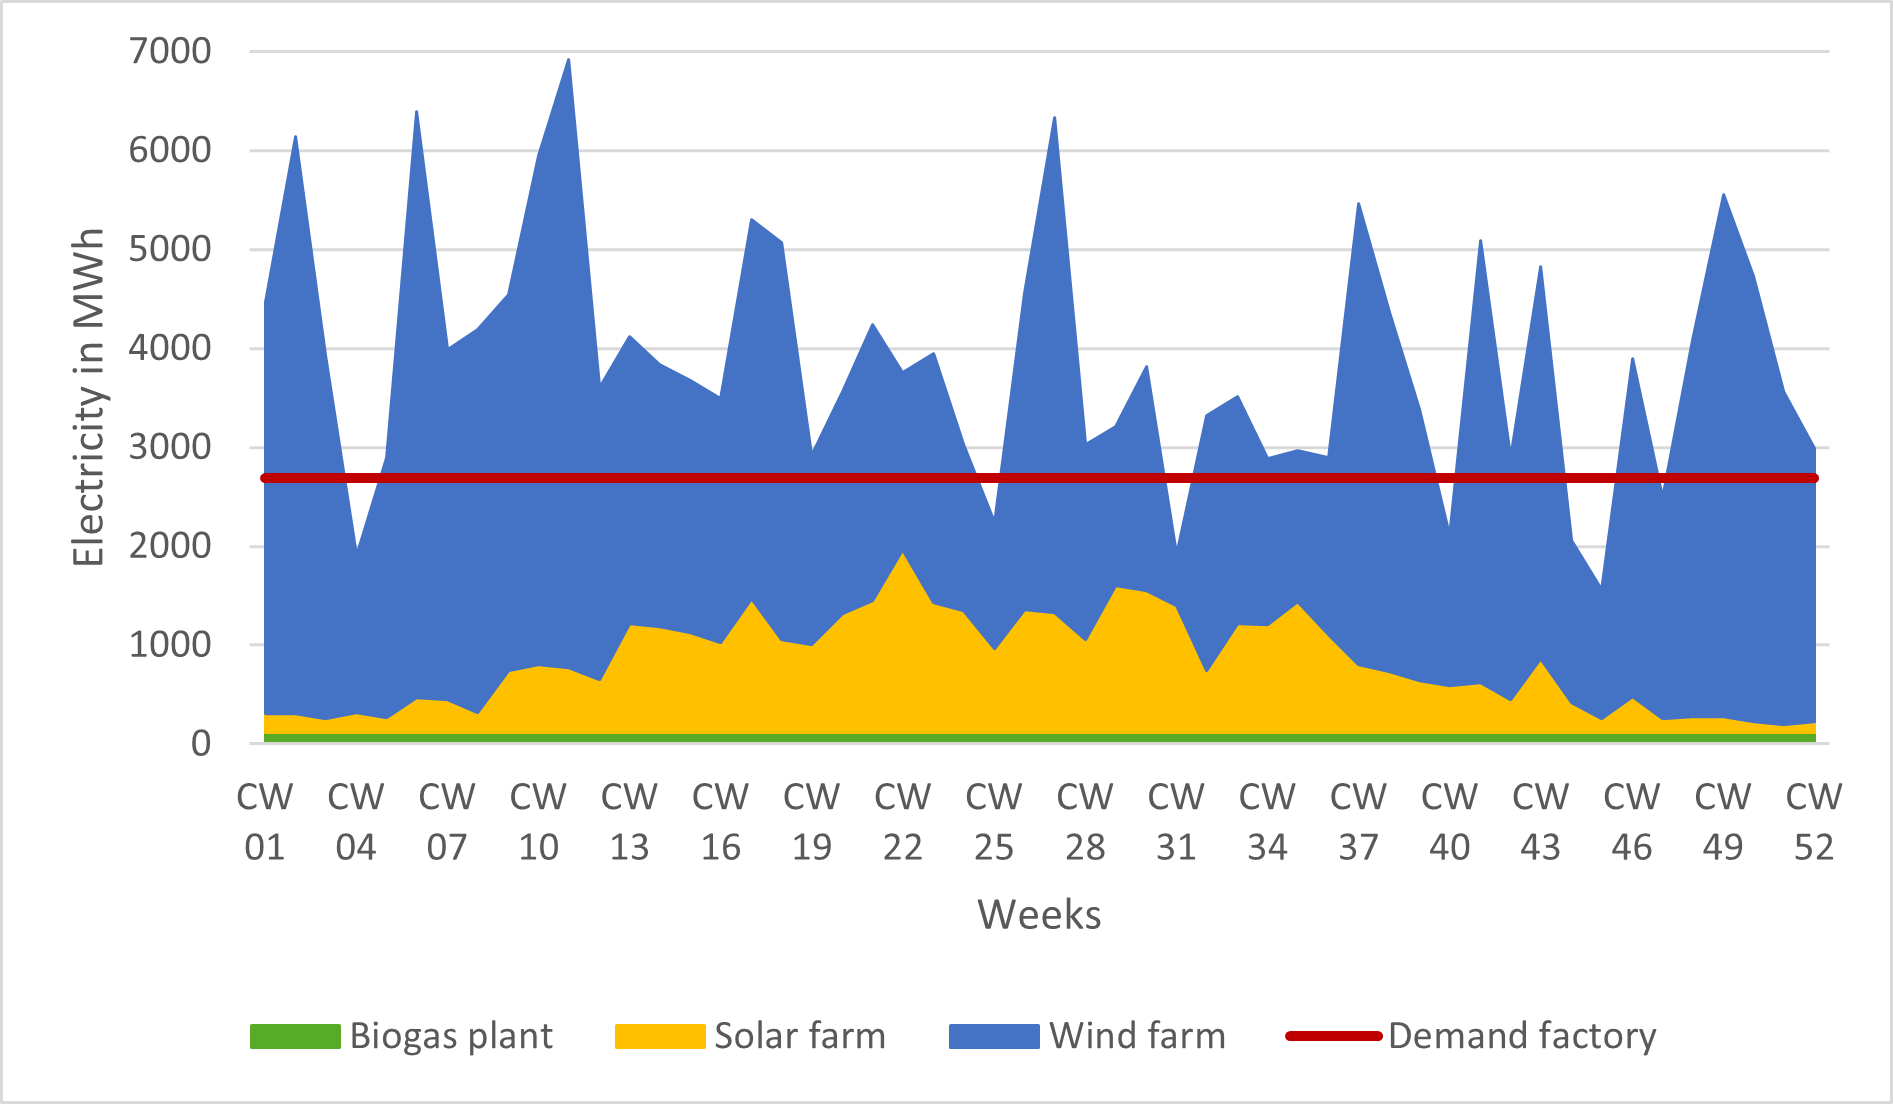
Figure 1: Load and yield profile on a weekly basis without battery storage
Figure 1 shows the load and yield profile of the starch factory on a weekly basis. It is demonstrated that the electricity demand does not reach 100 % using renewable energy resources for a period of seven weeks of the year. The shortfall can be explained through the reduced production by the WTGs. Overall, there is a significant overproduction of electricity which needs to be curtailed without the use of adequate storage media. Alternatively, the overproduction can be fed back into the grid.
The graphic also shows different production curves for solar and wind energy. Lower wind energy production during the summer month is balanced by an increased solar energy production.
Wind energy produces about 78.5 % of the total electricity production over the year which is ¾ of the annual yield. Whereas solar energy produces 18.5 % of the total production. The biogas plant generates only 3 % due to its significantly smaller size. Therefore, the renewable energy generation units produce a cumulative yield of approximately 203 GWh per year in total.
For the valuation of the demand coverage through renewable energy, the self-consumption, and autarky rate of the entire system are considered. The self-consumption rate indicates the proportion of the electricity consumed directly by the factory itself in relation to the total electricity produced. The autarky rate, meanwhile, outlines the proportion of self-generated and consumed electricity of the total consumer demand. The following illustration demonstrates the percentual values respectively to the yield profile of the renewable energy sources.
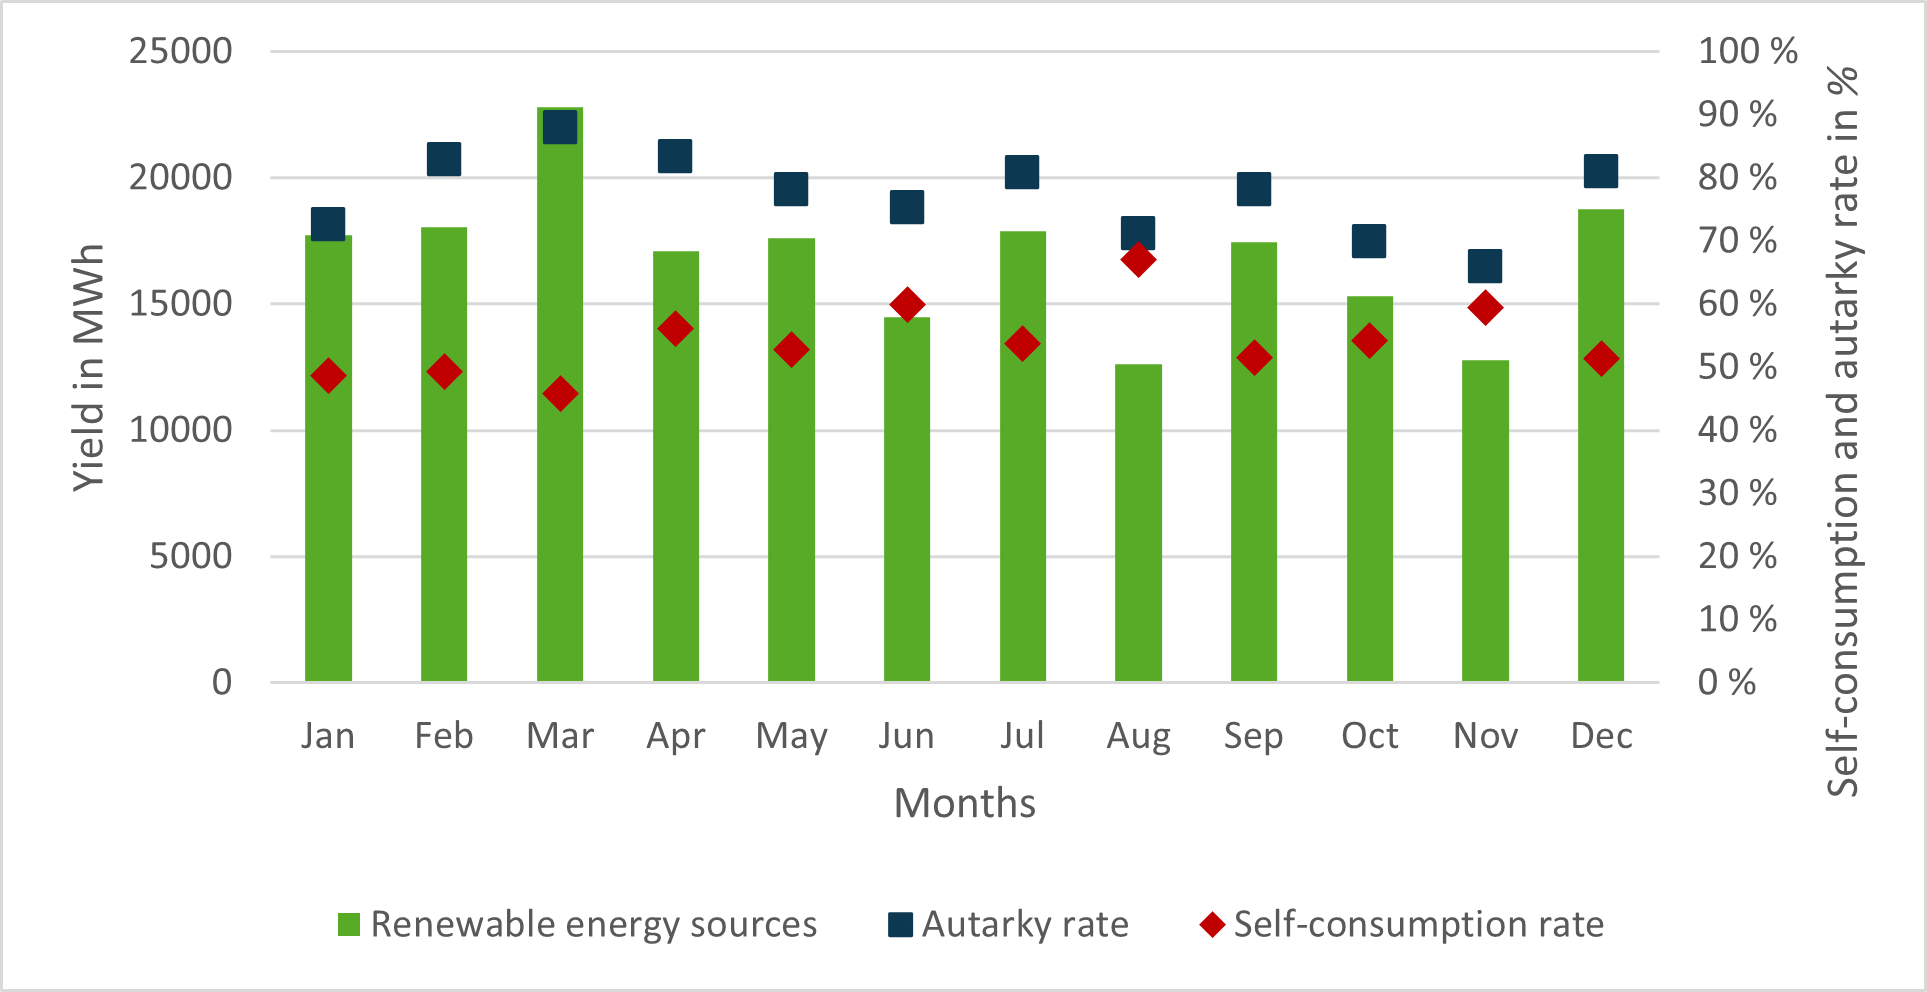
Figure 2: Self-consumption and autarky rate on a monthly basis without battery storage
The self-consumption rate established for this case study is between 40 % and 60 % in eleven out of twelve months. It reaches around 53 % on an annual average. August stands out with a self-consumption rate of approximately 67 %. Evidently, this is due to a low wind month resulting in distinctly lower yield peaks. The determined energy yield in August averages to 13 GWh. After deduction of the protein factory consumption, the energy yield has an overage of around 4 GWh, which ideally should be fed in and renumerated into the public grid. March shows the lowest self-consumption rate of only 46 % which however has the highest energy production but a considerable part of it cannot be used directly. The autarky rate is about 77 % for the entire year. Thus, March proves to be the month with the best autarky rate of 88 %.
In the figure below, the two parameters, autarky and self-consumption rate, as well as the yield of the regenerative energy sources are shown as mean values during the day.
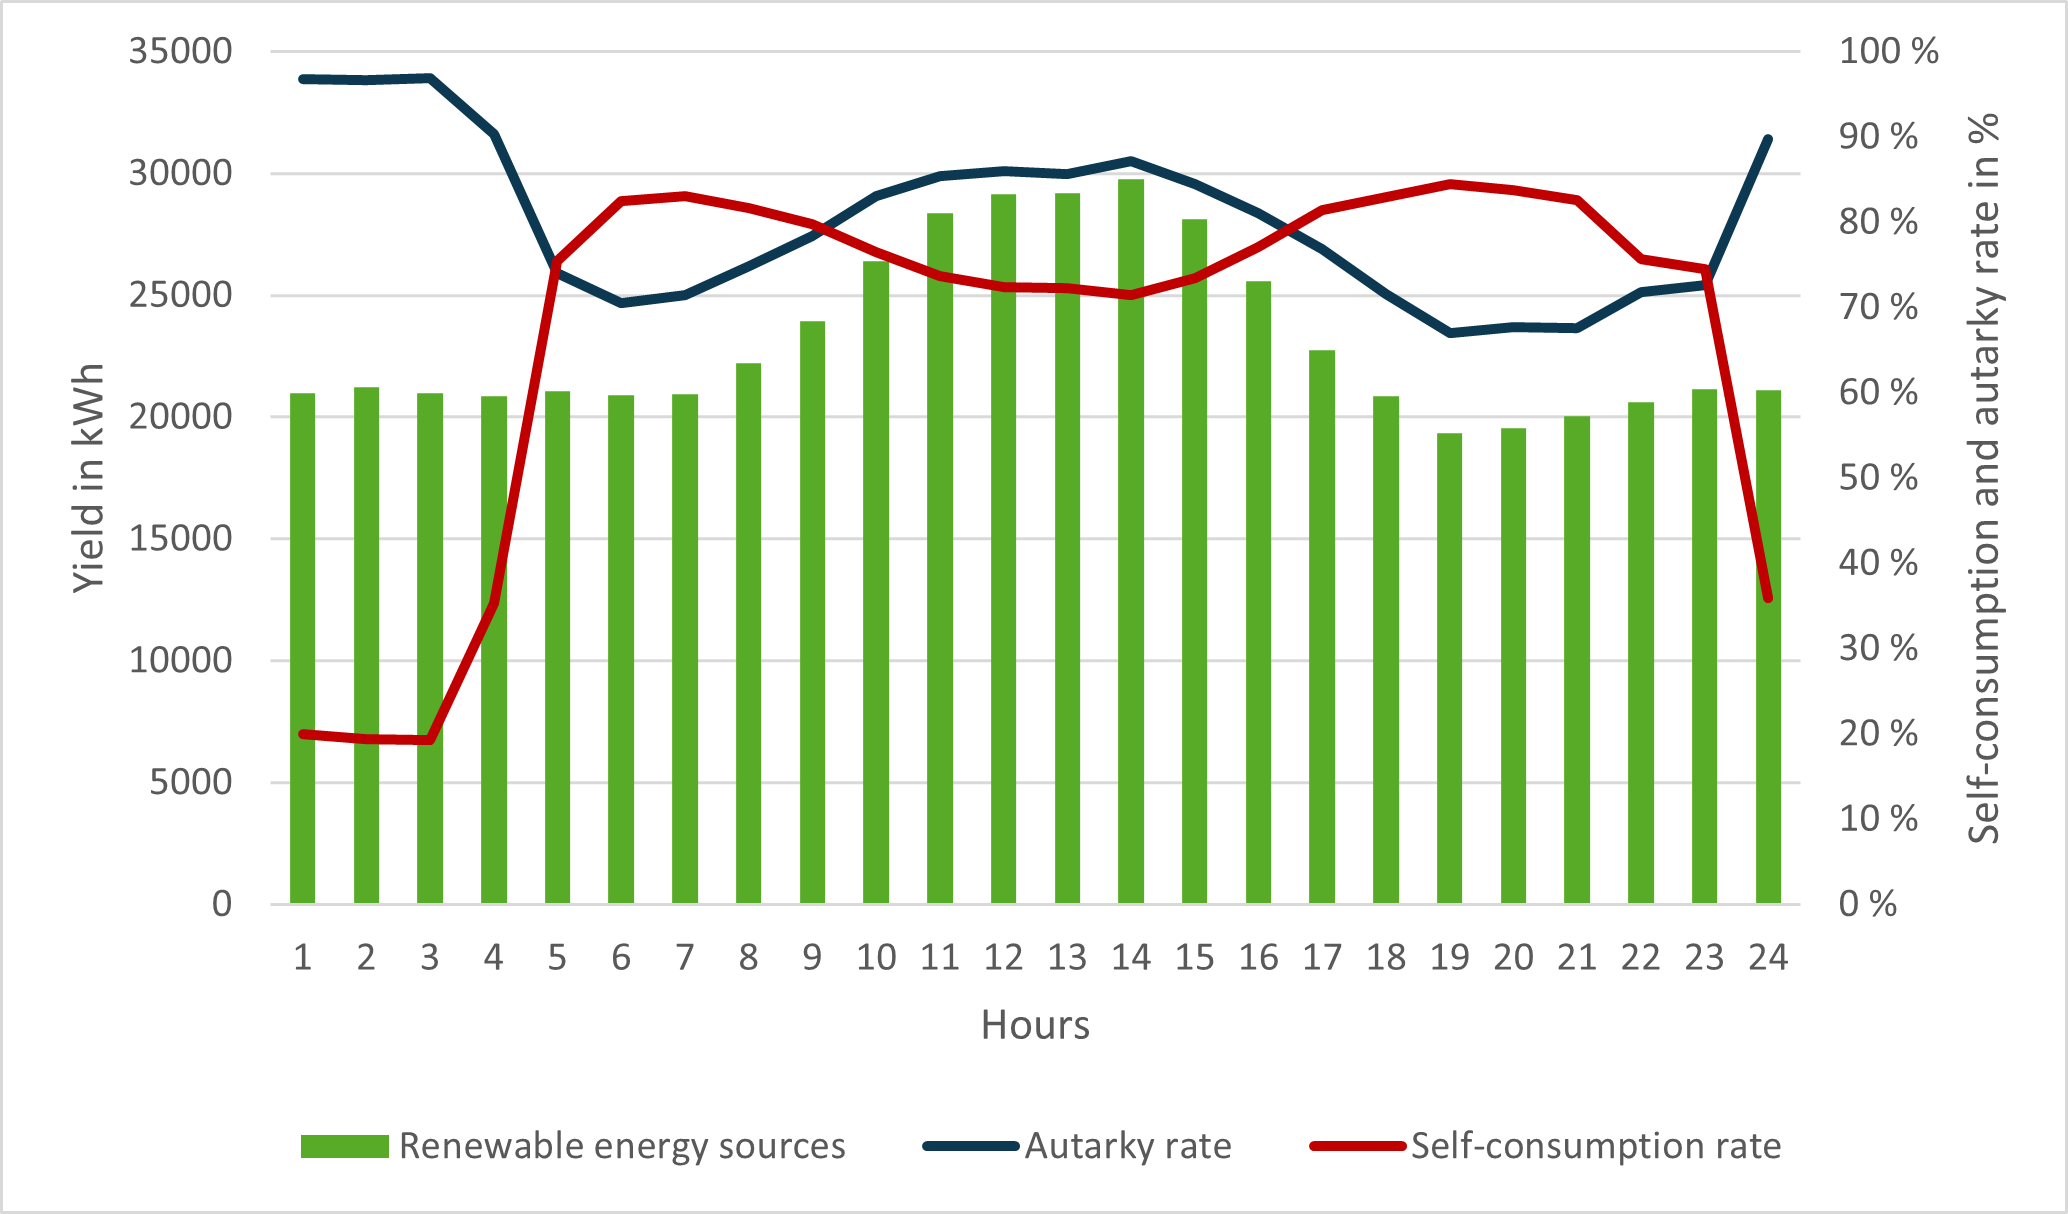
Figure 3: Average daily course of the self-consumption and autarky rate
The graph illustrates that the lowest load of the factory is in the morning hours, but consequently the autarky rate is the highest at around 97 %. Therefore, more than 80 % of the energy yield from the renewable generation plants would be fed into the grid, as the electricity cannot be used by the factory itself due to the low load.
Storage media can be used to solve this situation as the excess energy can be used when the yield is below the consumption of the factory.
Energy storage
In the case study, electricity and hydrogen storage are examined. Both types of storage media are already used for industrial applications.
Other energy storage technologies, such as compressed air systems or thermal storage are not considered in this study.
Battery storage
Lithium-ion batteries are used for the analysis instead of lead-acid batteries, due to their particularly high energy density (3) and better charging and discharging behaviour. An energy tool created by the University of Trier (4) helps to calculate the absorbed and released energy of the battery storage.
For this case study, a container solution from LG Energy Solution Europe GmbH is used. The investigation is based on two different storage sizes. The first scenario comprises a container with 4.5 MWh storage capacity and the second scenario has a total storage capacity of 10 MWh.
Figure 4 illustrates the storage capacity of the two different battery sizes for the respective months.
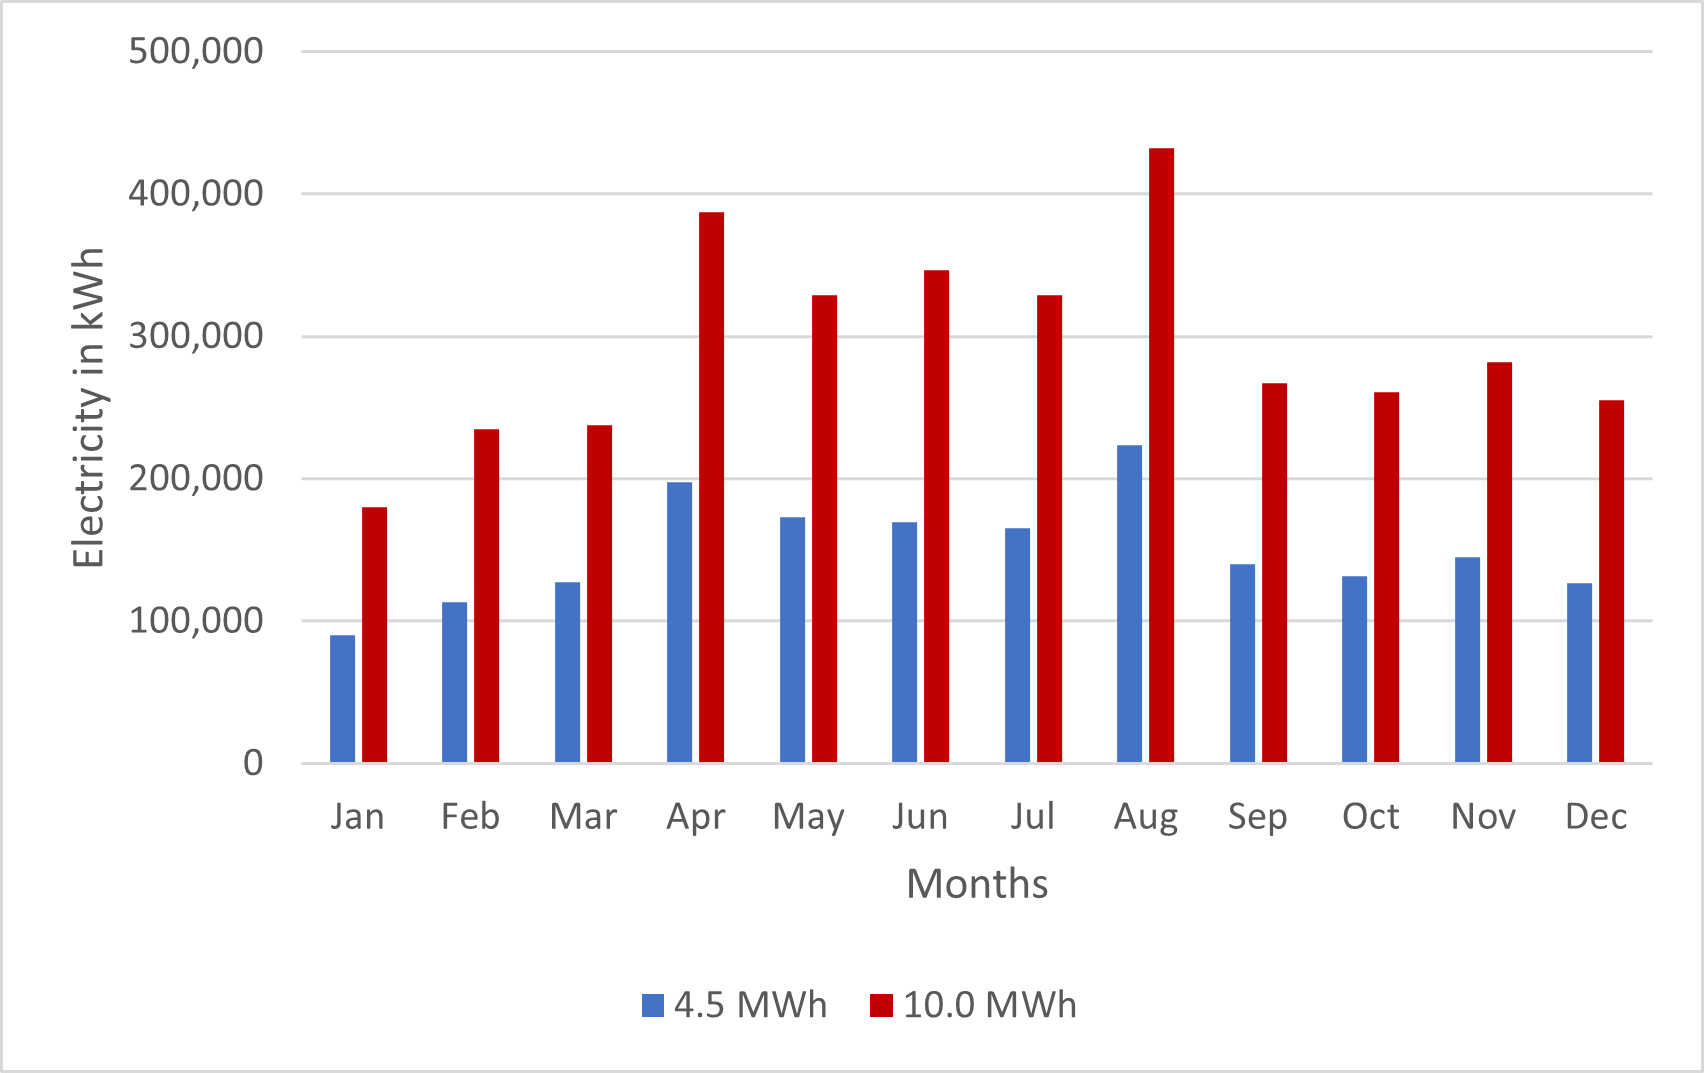
Figure 4: Charging performance of the two battery sizes on a monthly basis
The temporarily stored energy amount is highest in August as the battery value reaches about 12 % of the total charging power throughout the year during this month. This is due to the low electrical energy generated by wind turbines. This results in more frequent charging and discharging of smaller amounts of energy by the battery. In autumn and winter months, the factory´s energy requirements are more persistent and more often covered by 100 % direct renewable generated electricity without the need for storage. Therefore, the requirement of charging and discharging the battery is lower during those months.
The table below summarises the scenarios with and without battery for the case study.
| Energy budget per year | No battery | 4.5 MWh | 10.0 MWh |
|---|---|---|---|
| Electricity yield [MWh] | 202.568 | 202.568 | 202.568 |
| Electricity consumption [MWh] | 140.000 | 140.000 | 140.000 |
| Direct self-consumption [MWh] | 108.120 | 108.120 | 108.120 |
| Self-consumption from battery [MWh] | 0 | 1.670 | 3.248 |
| Grid reference [MWh] | 31.880 | 30.210 | 28.632 |
| Grid feed-in [MWh] | 94.449 | 92.647 | 90.907 |
| Battery losses [MWh] | 0 | 129 | 286 |
| Autarky rate [%] | 77 | 78 | 80 |
| Self-consumption rate [%] | 53 | 54 | 55 |
Table 1: Comparison of the energy budget per year without and with the two battery sizes
Both the self-consumption and autarky rate are increased by adding storage, but in this case study, the increase is rather low with a maximum of 3 percentage points.
Hydrogen production
Another way of storing excess energy, to adequately use it, is electrolysis. This has the advantage to produce climate-neutral hydrogen from renewable generated electricity. Currently, three different electrolysis technologies are used which are alkaline electrolysis (AEL), membrane electrolysis (PEM), and high-temperature electrolysis (SOEL; 5). The high-temperature electrolysis is not deemed to be technically mature. Therefore, it is not considered further in the case study (6).
Fuel cells are used to convert hydrogen back into electricity. Again, different types differ in their operating parameters. This case study does not observe specific fuel cells. Instead, the calculations are based on average values for efficiency. The efficiency can be over 60 % for real fuel cells (7).
Including an electrolyser and a fuel cell each with an installed capacity of 10 MW, the plant can generate 1,818 Nm³/h of hydrogen when using PEM technology and 2,000 Nm³/h when using AEL technology.
Furthermore, the case study compares the results of two different storage sizes. One has the capacity to accommodate 12 full load hours (FLh) and the other 24 FLh.
For this analysis, it is also presumed that the specific electrolyser electricity demand does not change when the load behaviour changes. The efficiency of the AEL is 71 % and PEM 65 % (8). An efficiency of 55 % is assumed for the conversion of hydrogen with the aid of a fuel cell (9). This efficiency is to be regarded as conservative. This results in an overall efficiency of around 39 % for AEL and 36 % for PEM. Due to its better efficiency, this case study will only consider the AEL technology going forward.
Table 2 indicates the possible annual yield for hydrogen production and reconversion. Firstly, these are shown without the use of a battery storage and secondly, with the two battery storage systems described prior.
| Energy balance per year | no battery | 4.5 MWh | 10.0 MWh |
|---|---|---|---|
| Overproduction [MWh] | 94.449 | 92.647 | 90.907 |
| Electrolyser full load hours [h] | 9.445 | 9.265 | 9.091 |
| Electrolyser utilisation [%] | > 100 | > 100 | > 100 |
| Max. yield hydrogen AEL [Nm3] | 13.411.696 | 13.155.853 | 12.908.755 |
| Max. yield electricity AEL [MWh] | 22.129 | 21.707 | 21.299 |
| Emptying storage tank AEL (12 FLh) [p.a.] | 559 | 548 | 538 |
| Emptying storage tank AEL (24 FLh) [p.a.] | 279 | 274 | 269 |
Table 2: Comparison of the energy budget per year for hydrogen production
In conjunction with a fuel cell, the converting of the previously generated hydrogen into electricity can theoretically produce a maximum of approximately 22.129 MWh (without battery) and 21.299 MWh (10 MWh). When looking at the storage sizes of 12 or 24 VLh for hydrogen, the table specifies the respective storage cycles.
Due to the high electricity surplus, the analysis shows a utilisation of the electrolyser of over 100 %. Therefore, it would be possible to increase the size of the electrolyser and convert more self-generated electricity into hydrogen in order to either convert it back into electricity or to use it for other purposes, such as driving vehicles. As a result, no further analysis of the self-consumption and autarky rate is carried out.
Economic Efficiency
The price development of energy sources is essential for the economic viability of the project. It is necessary to evaluate trends in order to provide a forecast for the next few years. The calculation for the temporarily stored electricity in the battery storage system and hydrogen production is particularly difficult. Table 3 shows the electricity generation costs of the three renewable energy sources used in this case study.
| Wind farm | Solar farm | Biogas plant | |
|---|---|---|---|
| Total -CAPEX [M. €] | 42,800 | 20,000 | 3,500 |
| CAPEX per MW electric [M. €] | 1,019 | 0,500 | 3,500 |
| OPEX over 20 years [M. €] | 42,612 | 9,257 | 20,412 |
| Total yield over 20 years electric [GWh] | 3,180 | 734 | 120 |
| LCOE [ct/kWh] | 3,18 | 5,06 | 20,73 |
Table 3: Comparison of the three renewable energy sources
The WF is the most expensive of the three renewable energy sources. But due to its performance and yield potential, it turns out to be the most favourable variant in terms of the levelised cost of electricity (LCOE). The LCOE of the biogas plant is more than six times the WF and the highest at 20.73 ct/kWh. However, it should be regarded that this is purely about electrical generation. The biogas plant generates roughly about the same amount of thermal energy as electrical energy. Therefore, the LCOE is effectively around 10.37 ct/kWh. Nevertheless, biogas plants can be financially worthwhile as a result of the EEG subsidy. The maximum bid values for new plants are set at 16.4 ct/kWh in the EEG 2021 (10).
The LCOE for solar power is in the middle range. However, this can be significantly reduced by considering the entire operating life of a solar system, which is on average 30 years. Solar power systems are usually still in good condition and suitable for seamless ongoing operation after the 20-year EEG expiry tariff. Calculated over 30 years, the LCOE for solar electricity would result in 4.33 ct/kWh in this case study. The LCOE of wind power could also be reduced through a longer operating period. However, for the continued operation of the WF, the need for extensive restoration or repowering measures are more likely.
The LCOE of lithium-ion batteries is more difficult to calculate, as there is a large variation, especially in terms of service life and operating costs. This case study is looking at the best-case and worst-case scenario with operating costs of 4.000 € and 7.000 € per MW and year.
The respective values for the battery storage result in the following LCOE over 15 years:
| 4.5 MWh | 10.0 MWh | |
|---|---|---|
| LCOE [€/MWh] – Best Case | 18,58 | 21,04 |
| LCOE [€/MWh] – Worst Case | 19,77 | 22,27 |
Table 4: LCOE of battery storage systems
The battery storage systems cannot be operated economically without state subsidies.
A feasibility calculation was not carried out for the electrolyser in this case study, due to the calculated utilisation and full load hours, which made it difficult without optimising the layout any further.
Conclusion
The project covering the factory’s renewable energy needs is ambitious and innovative. Nevertheless, the study shows that the project is fundamentally feasible as the factory could be supplied with at least 75 % from renewable sources. From an economic point of view, it is currently not possible to supply the factory completely with renewable energy produced in the immediate surroundings. However, the case study demonstrates that sustainable production with low energy costs can be established with the available technologies.
There are still only a few comparable concepts and solutions in Germany to provide the direct power supply of an industrial plant mainly through the production of renewable energy. The factory construction alone is already a complex project. The complexity is further influenced by the integration of fluctuating renewable energy sources.
To guarantee the economic and financial viability of such innovative and holistic energy concepts in the long term, it is necessary to continuously improve the energy policy framework conditions over the entire lifetime of the plant by also offering innovation subsidies. The development potential and acceptance could be increased significantly which could also result in a rethink in the energy transition in the industrial sector.
Holistic, technology-open energy concepts that consider various energy sources, are key to a CO2-neutral future. It is the task of the legislators to create the appropriate framework conditions and to establish standards from pilot studies, like this case study, to further advance the energy transition.
This article is based on the bachelor thesis from Alexander Heide, University of Applied Science in the Department of Engineering – Energy and Information under Prof. Dr.-Ing. Joachim Twele.
By: Alexander Heide
(1) Software von der Universität Genf
(2) https://biogas.fnr.de/biogas-nutzung/waerme
(3) https://www.bundestag.de/resource/blob/412904/ca2dd030254284687a1763059f1f4c0c/wd-8-032-14-pdf-data.pdf, S. 11
(4) https://www.umwelt-campus.de/energietools
(5) Robert Sohst (2017). Ferngesteuerte Leistungsreduzierung von Windenergieanlagen und deren optimierte Einbindung in Elektrolyse-Systeme [Doktorarbeit]. Berlin: Technische Universität Berlin, S. 75
(6) Robert Sohst (2017). Ferngesteuerte Leistungsreduzierung von Windenergieanlagen und deren optimierte Einbindung in Elektrolyse-Systeme [Doktorarbeit]. Berlin: Technische Universität Berlin, S. 82
(7) Volker Quaschning (2019). Regenerative Energiesysteme: Technologie; Berechnung; Klimaschutz. 10., aktualisierte und erweiterte Auflage. München: Hanser. ISBN 978-3-446-46113-0, S. 409
(8) Robert Sohst (2017). Ferngesteuerte Leistungsreduzierung von Windenergieanlagen und deren optimierte Einbindung in Elektrolyse-Systeme [Doktorarbeit]. Berlin: Technische Universität Berlin, S. 135
(9) Robert Sohst (2017). Ferngesteuerte Leistungsreduzierung von Windenergieanlagen und deren optimierte Einbindung in Elektrolyse-Systeme [doctoral thesis]. Berlin: Technical University Berlin, P. 144
(10) https://www.energas-gmbh.de/eeg-2021/

